TO EXAMINE a.c. VOLTAGE
Apparatus
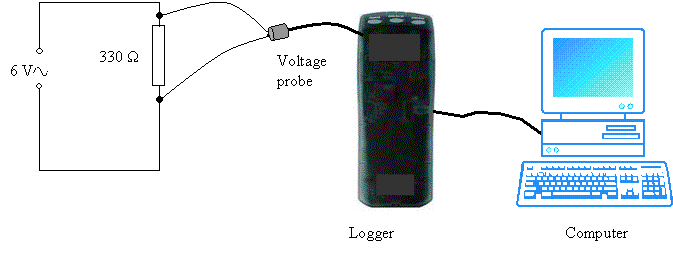
Logger, voltage probe, computer, a.c.supply and 330 Ω resistor.
Arrangement
1.
Set up
the circuit shown in the diagram.
2. Connect the voltage probe to CH1 of the logger.
3. Connect the logger to the computer.
4. Start the computer logger program.
5. Click on Set Up.
6. In the Set Up menu click on Data Collection.
7. In the pop-up window, click on Real Time Collect.
8. Click on Sampling Set Experiment Length at 0.2s.
Set Sampling Speed at 10000 per sec.
9. Click OK.
Procedure
1. Switch on the a.c. supply.
2. Click
on ![]() .
.
3. Observe the pattern on the screen.
4. Click on Analyse.
5. Select Examine.
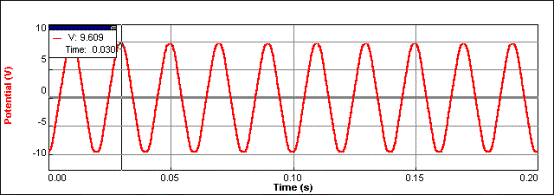
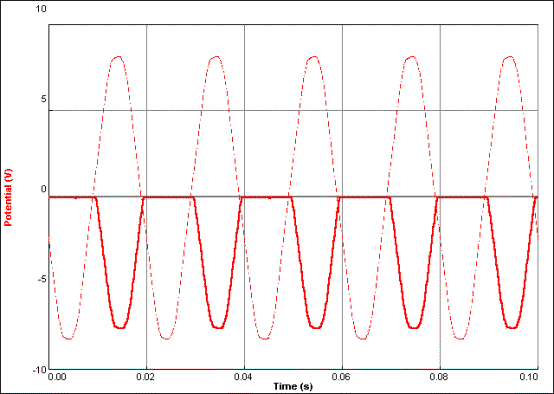
6. Use the mouse to select a peak and read the value of the peak voltage which is 9.609 V in this example.
7. Connect a multimeter to the a.c. supply and read the voltage which is 6.78 V. This is the r.m.s. voltage.
8. Find the relationship between VPeak and Vrms.
It is found VPeak
= √2 Vrms (within experimental error).
Note
The voltage probe could be connected directly to the voltage
supply.
.
To Measure Mains Frequency
Apparatus
Logger, voltage probe, computer, a.c. supply and 330 Ω resistor.

Arrangement
1.
Set up
the circuit shown in the diagram.
2.
Connect
the voltage probe across the resistor.
3. Connect the voltage probe to CH1 of the logger.
4. Connect the logger to the computer.
5. Start the computer logger program.
6. Click on Set Up.
7. In the Set Up menu click on Data Collection.
8. In the pop-up window, click on Real Time Collect.
9. Click on Sampling. Set Experiment Length at 0.2s
Set Sampling Speed at 10000 per sec.
10. Click OK.
Procedure
1. Switch on the a.c. supply.
2. Click
on ![]() .
.
3. Observe the pattern on the screen.
4. Click on Analyze.
5. Select Examine.
6. Use
the mouse to select a peak and read the time from the graph, 0.030 s.

7. Move
on five peaks to the right and take the time reading again, 0.130 s.
![]()
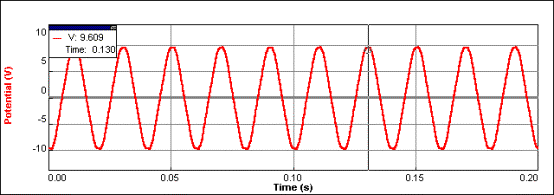
This gives the
period, T, of the wave to be ![]() = 0.02 s.
= 0.02 s.
Frequency ![]() Hz.
Hz.
Note
The voltage probe could be connected directly to the voltage supply.
To Demonstrate Half-Wave Rectification
Apparatus
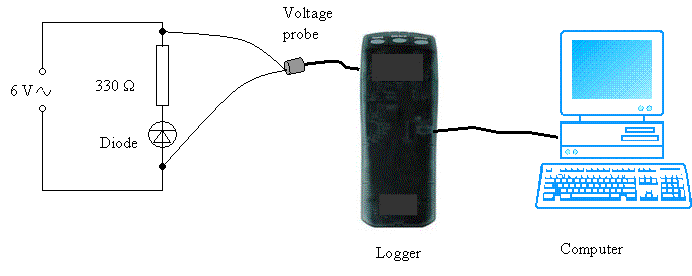
Logger, voltage probe, computer, a.c. supply, diode and 330 Ω resistor.
Arrangement
1. Connect the diode and the resistor to the 6V a.c. supply as shown.
2. Connect the voltage probe to CH1 of the logger.
3. Connect the logger to the computer.
4. Start the computer logger program.
5. Click on Set Up.
6. In the Set Up menu click on Data Collection.
7. In the pop-up window, click on Real Time Collect.
8. Click on Sampling Set Experiment Length at 0.1s
Set Sampling Speed at 10000 per sec.
9. Click OK.
Procedure
1. Switch on the a.c.supply.
2. Connect the voltage probe across the output of the a.c. supply
3. Click
on ![]() .
.
4. Observe the pattern on the screen (Run 1).
5. Click
on Data.
6. Select
Store Latest Run – graph is saved (broken lines).
7. Now
connect the voltage probe across the resistor.
8. Click
on ![]() .
.
9. Observe
the pattern on the screen (Run 2) – only half of the wave is present.
10. Reverse the
diode and repeat the experiment (Run 3).
Run 2 Run 1![]()
![]()
Note
This experiment can be done using two voltage probes, allowing both patterns to be viewed simultaneously.
The probes are connected to CH1 and CH2 of the logger. One probe is connected to the output of the
a.c. supply and the other is connected across the resistor. Ensure that polarities of the probe leads
are connected in common i.e. the red leads are both connected the same side of
the resistor.
The sampling speed should be set to 5000 per second.
The two patterns can be viewed by setting the Graph Layout option to 2 Panes when using View in the computer program.
TO Examine Sound
Apparatus
Logger, microphone sensor, computer, and tuning forks.
Arrangement
1. Connect the microphone to CH1 of the logger.
2. Connect the logger to the computer.
3. Start the computer logger program.
4. Click on Set Up.
5. In the Set Up menu click on Data Collection.
6.
In the pop-up window, click on Real Time Collect.
7. Click on Sampling. Set Experiment Length at 0.03s
Set Sampling Speed at 10000 per sec.
8. Click OK.
Procedure
1. Hold a vibrating tuning fork in front of the microphone.
2. Click
on ![]() .
.
3. Observe the pattern on the screen.
4.
Click on Analyse.
5. Select Examine.
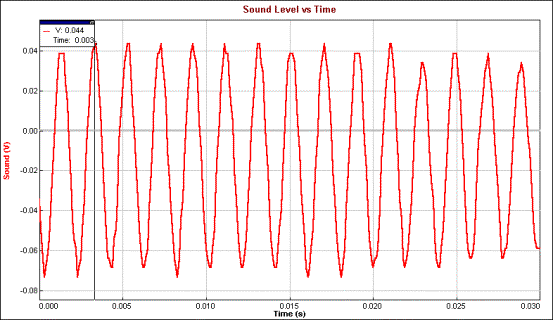
6. Use the mouse to select a peak and read the time t1 from the graph.
7. Count on ten peaks and take the time t2.
![]()
The period T of the wave = ![]() and frequency
and frequency![]() .
.
Notes
Experiment Length may have to be varied depending on the range of frequencies used.
If there is background noise, it may be necessary to use a trigger setting.
Harmonics, which will distort the pattern produced, may occur for low frequency tuning forks (200-320 Hz). Striking the tuning fork more gently to set it vibrating will reduce this distortion.
Ensure that the Data Collection mode is Real Time Collect as it sometimes changes to Repeat.