Measurement of g
PC Method
Apparatus
Picket Fence, retort stand with clamp, Vernier Photogate, PC with Logger Pro installed, LabPro interface
To
USB Link
Figure 1
Procedure
1. Clamp the Photogate rigidly to a retort stand as shown in Figure 1. To avoid damaging the Picket Fence, make sure it has a soft surface to land on.
2. Connect the Photogate to the DIG/SONIC 1 input of the LabPro
3. Open the file in the Experiment 5 folder of Physics with Computers. Two graphs will appear on the screen. The top graph displays distance vs. time, and the lower graph velocity vs. time.
4. To view a table of results click Window followed by New Tall Window followed by Table.
5. Click ![]() .
Hold the top of the Picket Fence and drop it through the Photogate,
releasing it from your grasp completely before it enters the Photogate. Be
careful when releasing the Picket Fence as it must not touch the sides of the
Photogate as it falls and it needs to remain vertical. Click
.
Hold the top of the Picket Fence and drop it through the Photogate,
releasing it from your grasp completely before it enters the Photogate. Be
careful when releasing the Picket Fence as it must not touch the sides of the
Photogate as it falls and it needs to remain vertical. Click ![]() to end data collection.
to end data collection.
6. The slope of a
velocity vs. time graph is a measure
of acceleration. If the velocity graph
is approximately a straight line of constant slope, the acceleration is
constant. If the acceleration of your Picket Fence appears constant, fit a straight
line to your data. To do this, click on the velocity graph once to select it,
then click ![]() to fit the line y = mx + b to the data. Record the slope in the table.
to fit the line y = mx + b to the data. Record the slope in the table.
7. Repeat Steps 5 and 6 five more times. Do not use drops in which the Picket Fence hits or misses the Photogate. Record the slope values in the table.
Sample Results
|
Trial |
1 |
2 |
3 |
4 |
5 |
6 |
|
Slope (m/s2) |
9.804 |
|
|
|
|
|
|
Acceleration due to gravity, g |
m/s2 |
Figure 2
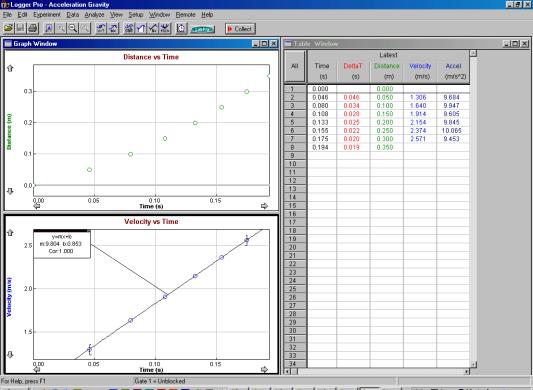
The acceleration due to gravity (g) has
been measured to an accuracy of better than 0.5%. In this trial it was found to be 9.8ms-2. is
Conclusion