Measurement of the acceleration due to gravity using the graphic calculator
Apparatus
Picket fence, retort stand with clamp, photogate, data
logger and graphic calculator with DATAGATE program installed.
Arrangement
- Clamp the photogate rigidly to a retort stand so the arms extend horizontally, as shown above. To avoid damaging the picket fence, make sure it has a soft landing surface.
- Connect the calculator to the data logger.
- Connect the photogate to DIG/SONIC port of the data logger.
- Turn calculator ON.
- Press
 .
. - Select DATAGATE.
- Press
 .
.
8. Select .
9. Select .
10. Select .
11. Select .
12. Select .
Procedure
1. Hold the top of the Picket Fence and drop it vertically through the photogate.
2.
Using the cursor ![]() select and press
select and press ![]() .
.
3. Examine the VS TIME graph (Fig.1).
·
Press ![]()
· Select RETURN TO MAIN SCREEN
· Select
· Select
· Select
The
screen now shows the equation of the line ![]() ( Fig.2)
( Fig.2)
· Record the slope
·
Press ![]() to see the fitted
line with the data
to see the fitted
line with the data
·
Press ![]()
· Select
· Select
4 Repeat procedure steps 1, 2 and 3 five more times to get average for g.
Sample
Results
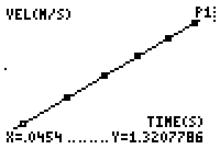
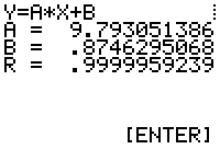
Fig. 2
Fig. 1
The slope of the velocity versus time graph, i.e. A as given on the screen, is a measure of acceleration due to gravity.
In this case the value of g is found from the graph to be 9.79 m s-2.